Every day, students across Belgium make their way from home to campus using different methods of transport. Whether they take public transport, cycle, or drive, their choices are shaped by a variety of factors.
In this blog post, we’ll dive into how Belgian students get around, highlighting key trends, regional differences, and the factors that influence their commutes.
From Brussels’ extensive public transport system to the strong cycling culture in Flanders, we’ll explore the different ways students travel to class.
Based on a survey of 234 Belgian students, we’ll share insights into the most popular transportation options, how satisfied students are with their commutes, the challenges they face, their sense of safety, and much more.
Do students prefer public or private transport?
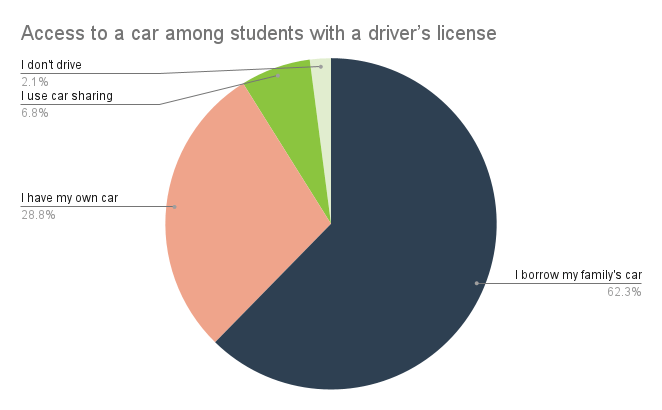
To start our research, we asked students whether they prefer public or private transportation. The results show that 55.1% favor public transport, while 44.9% opt for private options.
This split shows that both options play a key role in student mobility.
Students with driver’s licenses: Who drives and how?
While many students rely on public transport, a significant portion also hold a driver’s license.
But how many actually have access to a car, how often do they drive, and do they see car ownership as a necessity? Let’s take a closer look at what the data reveals.
How many students have a driver’s license?
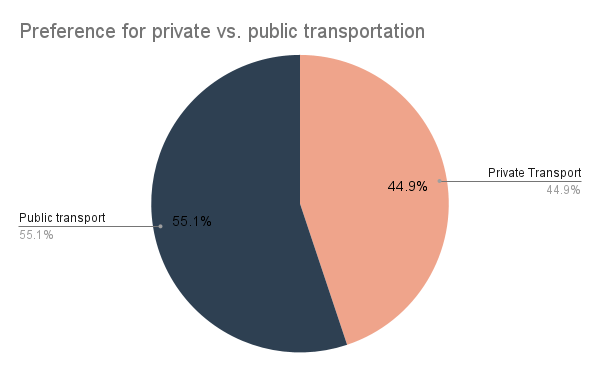
According to our survey, 62.4% of students have a valid driver’s license, while 37.6% do not. This means that while a majority of students have the ability to drive, a large portion still depend on other modes of transportation.
Do students have access to a car?
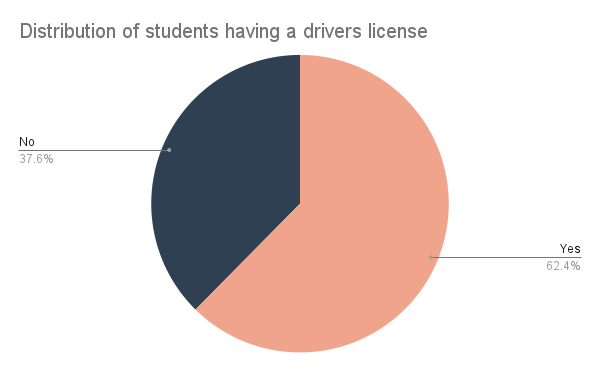
Among licensed students, most (62.3%) borrow a car from family rather than owning one themselves. Only 28.8% have their own vehicle, while 6.8% use car-sharing services. Interestingly, 2.1% of students have a license but don’t drive at all.
These numbers show that while many students can drive, car ownership remains low, with borrowing from family being the most common solution.
How often do students drive?
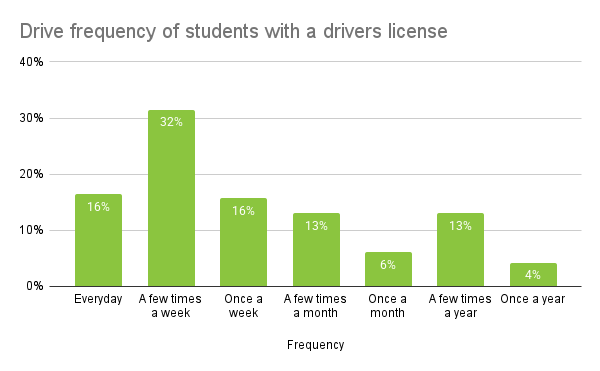
Driving habits among students vary widely. While 31.5% drive a few times a week and 16.4% drive daily, others use a car far less frequently. Some students drive once a week (15.8%), while 13% drive only a few times a month, and another 13% just a few times a year. while 6.2% drive once a month. A minority of students (4.1%) indicated that they drive only once a year.
These numbers suggest that while some students rely on a car regularly, a large group only drives occasionally.
Is owning a car in Belgium perceived as a necessity by students?
Do students see car ownership as essential in Belgium? The responses were mixed. Just over half (51%) believe having a car is necessary, while 36% remain neutral, and 13% disagree.
These findings highlight a general tendency among students to recognize the importance of having access to a car, although a significant portion remains undecided or don’t consider it essential for their mobility.

Transportation modes: How do students get to school?
After looking into student drivers and their habits, it's time to explore how students get around to school overall, whether they’re hopping on public transport, cycling, walking or taking the car.
In this section, we'll uncover the most popular transportation modes, the types of public transport subscriptions students use, and how much they spend on commuting. We’ll also examine who is responsible for covering these transportation costs. Let’s dive in!
Transportation modes to school
When it comes to getting to school, public transportation is the most common choice, with 35.5% of students using buses, the metro, or trams as their primary mode of transport.
Following that, 19.2% of students prefer walking to school, and 17.5% choose to bike.
15.4% take the train, while 12% drive their own car. A very small percentage 0.4% use electric scooters for their commutes.

Types of public transport subscriptions among students
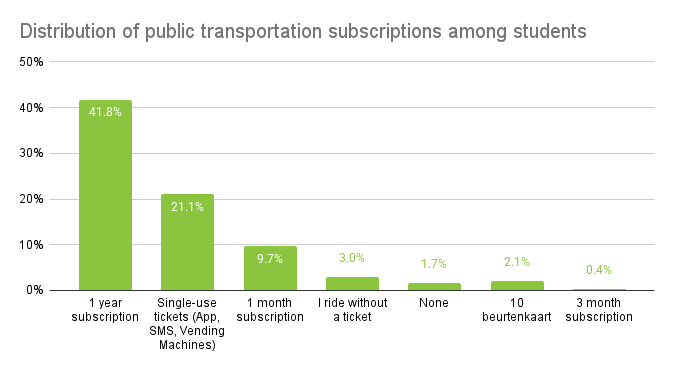
Most students seem to prefer longer-term options when it comes to public transport.
41.77% of students hold a 1-year subscription, making it the most popular choice. For those who use public transport less frequently, 9.7% opt for a 1-month subscription. A notable portion of students (20.11%) use single-use tickets, with 3.38% purchasing them via SMS, 10.98% through an app, and 6.75% from vending machines.
Additionally, 2.11% of students use a 10-ride pass, while 1.69% do not have any public transport ticket at all.
Transportation expenditure distribution
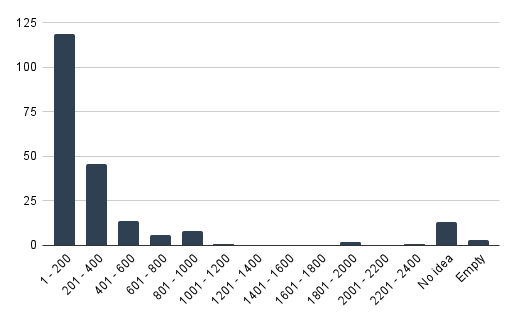
When it comes to transportation costs, 50.8% of students spend between 1 and 200 euros annually. The next largest group, 19.7%, spends between 201 and 400 euros. A smaller group spends 401 to 600 euros (6%), and even fewer students, 2.6%, spend between 601 and 800 euros.
Higher expenditure categories are less common, with just 3.4% of students spending between 801 and 1000 euros. Only 0.9% report spending between 1601 to 2000 euros annually. A small percentage of students are unsure about their spending (5.5%), and 1.3% left the question blank.
Responsibility for paying transportation fares
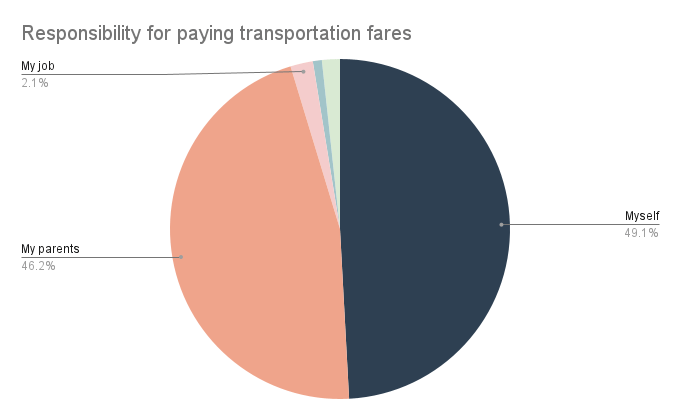
Who covers the costs of transportation? The majority of students, 49%, pay for their own fares. 46.2% have their parents cover the costs. A smaller group, 2.1%, say their job covers their transportation expenses, while 1.7% mention that their university takes care of the fares.
Public transportation usage in Belgium
Belgium offers several public transportation options, and students tend to favor certain transport companies over others. In this section, we’ll look at which services students use the most and how their preferences vary across different regions in Belgium.
Analysis of public transport usage in Belgium
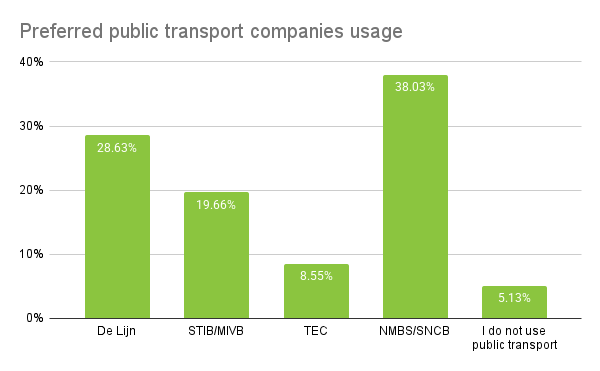
Student transportation choices show a strong preference for certain services. The National Railway Company of Belgium (NMBS/SNCB) is the most popular, with 38.03% of students relying on its trains.
De Lijn follows with 28.63%, while STIB/MIVB in Brussels accounts for 19.66% and TEC in Wallonia for 8.55%.
Notably, 5.13% of students don’t use public transportation at all, indicating that while most rely on it, some prefer other commuting methods.
These findings highlight rail transport as the backbone of student mobility, supported by regional bus and metro services.
Public transport usage by school region
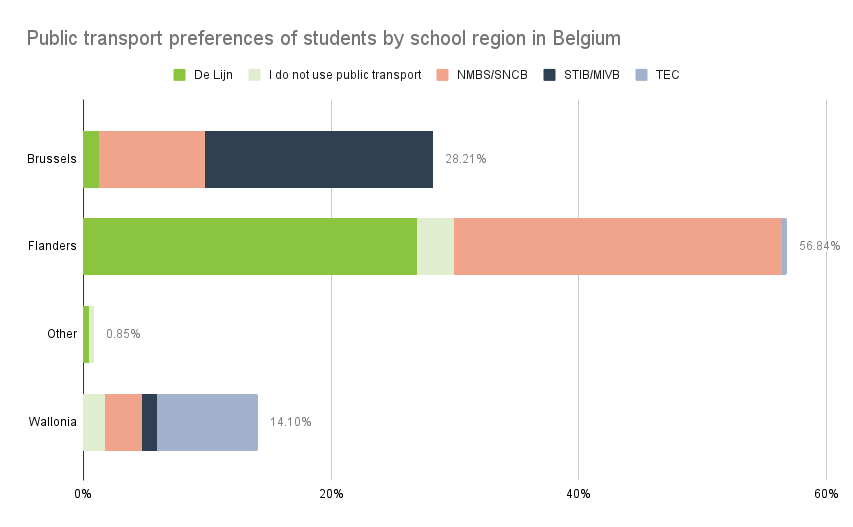
Breaking down public transport usage by region reveals some interesting regional variations.
In Brussels, where 28.21% of students from the survey study, STIB/MIVB is the most common choice for public transport, with 18.38% of respondents using it.
In Flanders, 56.84% of students in the survey study there, and the main transport services used are De Lijn (26.92%) and NMBS/SNCB (26.50%).
In Wallonia, 14.10% of the students study there, and public transport usage is less pronounced, with NMBS/SNCB used by 2.99% of students and TEC by 8.12%.
Overall, the data highlights that Brussels and Flanders see higher levels of public transport usage, reflecting the more extensive networks in those regions.
The commute: How do students experience their journey to school?
In this section, we delve into students' commuting experiences exploring the challenges they face, their wait times, the need for transfers, and how safe they feel during their daily journey to school.
Distance between students' residence and campus
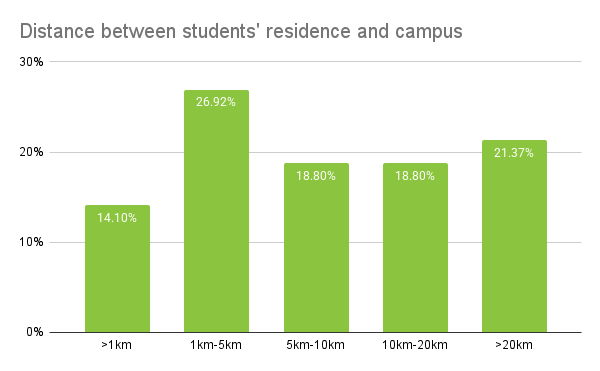
The distance students travel to reach their campus varies significantly, with 14.1% of students living within 1 km of their school, , while 26.9% live between 1 and 5 km away, making their commute relatively short.
On the other hand, 21.4% of students reside more than 20 km from their campus, highlighting that a significant portion of students face long-distance commutes.
The remaining students are spread across the 5–10 km, and 10–20 km ranges, with an equal 18.8% residing in these ranges.
These findings suggest that while some students enjoy a quick commute, many are faced with longer travel times to school.
Commute duration from home to school
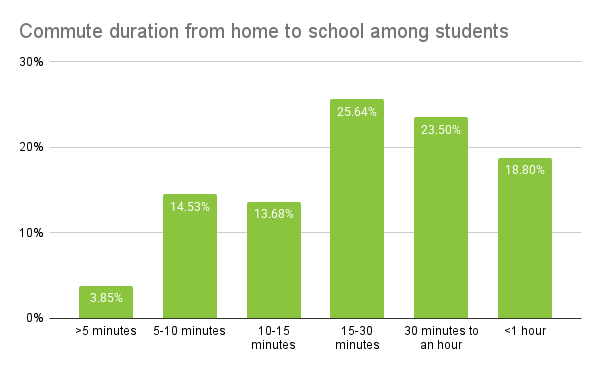
The survey results indicate diverse commuting durations. While a small 3.85% of students enjoy commutes of less than 5 minutes, while 14.53% travel between 5 and 10 minutes. Similarly, 13.68% of respondents require 10 to 15 minutes to reach their campus.
The most common commute duration falls within the 15–30 minutes range, reported by 25.64% of students. Many others experience longer commutes, with 23.50% of students traveling between 30 minutes and 1 hour, and 18.80% commuting for over an hour.
These varied commute times suggest that while some students can quickly get to campus, many are burdened with lengthy travel, which could affect their daily routines.
Weekly commute patterns of students
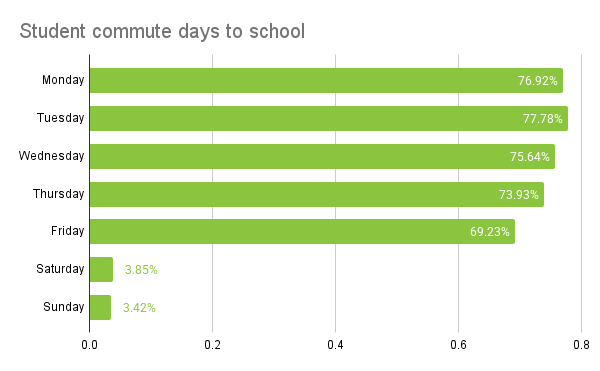
When analyzing students' weekly commute patterns, the most commuted day is Tuesday (77.78%), followed closely by Monday (76.92%) and Wednesday (75.64%). As the week progresses, the commuting rate slightly declines, with only 69.23% commuting on Friday.
This shows that the start of the workweek sees stronger commuter engagement.
It's also obvious that the weekend has significantly lower commuting rates, with just 3.85% commuting on Saturday and 3.42% on Sunday.
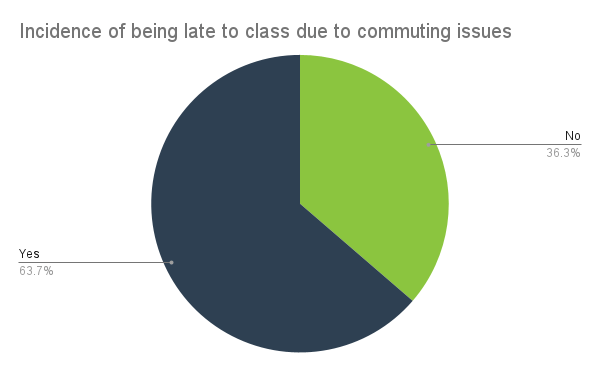
Incidence of being late to class due to commuting issues
Our recent study indicates that a significant portion of students, 63.7%, have experienced being late to class due to commuting issues.
In contrast, 36.3% of respondents reported that they have not faced such delays.
This suggests that commuting challenges are a common concern among student, potentially impacting their academic punctuality.
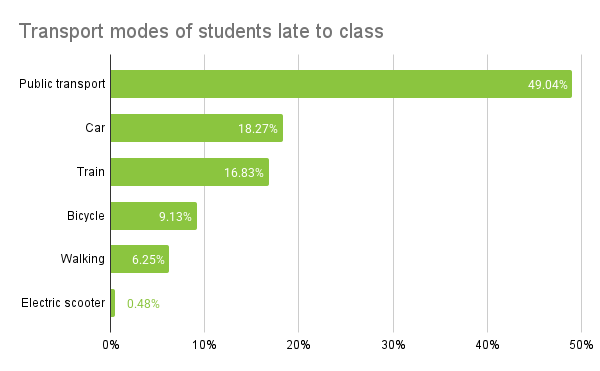
Modes of transport used by students late to class
For students who reported being late to class, the majority rely on public transport (buses, trams, metros) at 49.04%.
Other common transport modes include cars (18.27%), trains (16.83%), and bicycles (9.13%). A small number of students rely on walking (6.25%), while electric scooters are the least used mode (0.48%).
This highlights the central role public transport plays in students’ daily commutes, but also suggests that delays in the public transport system can significantly impact students' ability to arrive on time.
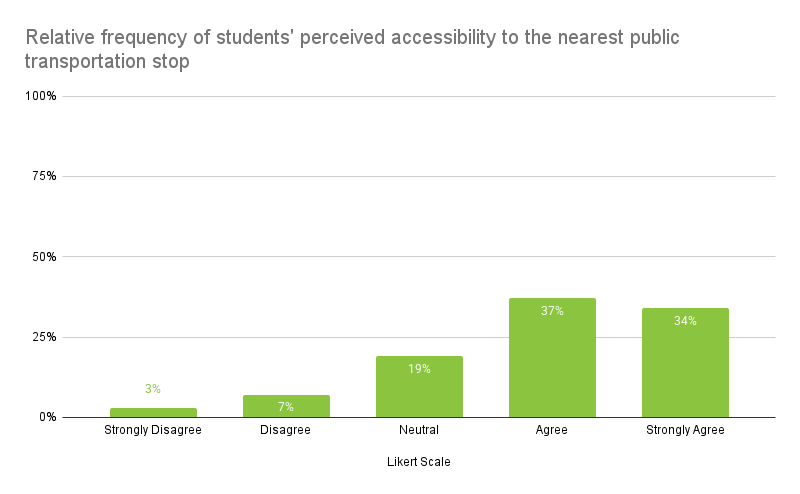
Students' perceived accessibility of nearest public transportation from home
Most students (37%) believe that the nearest public transportation stop is easy to reach, and an additional 34% strongly agree with this.
This means that most students perceive to have convenient access to public transport.
However, 19% of students were neutral about the accessibility, while 7% disagreed, and 3% strongly disagreed.
This shows that while public transport is generally perceived as accessible for many, there are still some students who face challenges.
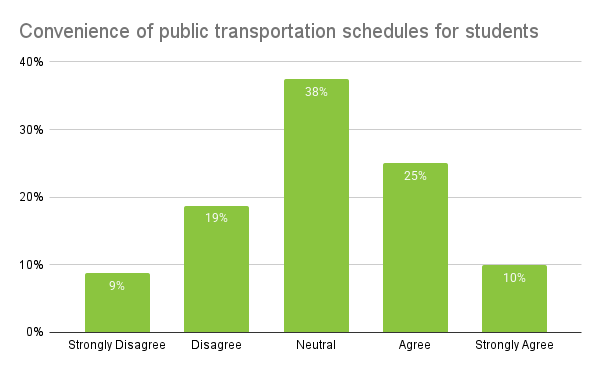
Convenience of public transportation schedules for students
The data reveals that 38% of students feel neutral about the convenience of public transportation schedules, indicating neither satisfaction nor dissatisfaction.
25% of students agree that the schedules are convenient, while 10% strongly agree.
On the other hand, 19% of students disagree, and 9% strongly disagree with the convenience of the schedules.
These findings provide valuable insight into the varying levels of satisfaction with public transportation schedules, indicating that while most students find the schedules acceptable or neutral
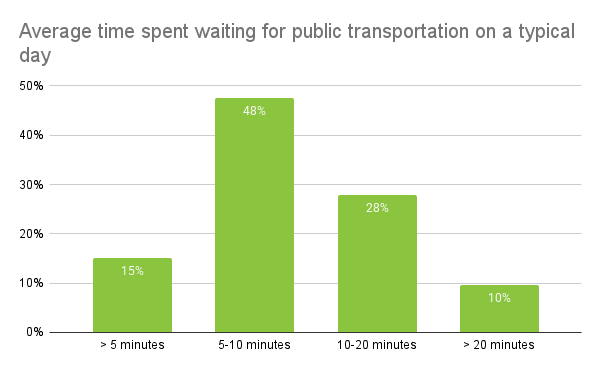
Average time spent waiting for public transportation on a typical day
For most students, the waiting time for public transportation is relatively short, with 47.5% of students waiting 5 to 10 minutes for their ride.
However, 27.92% report waiting between 10 to 20 minutes, and 15% face waits of more than 20 minutes. Only 9.58% of students report waiting for over 20 minutes.
This data suggests that while the majority of students experience short waiting times, a significant portion of students face longer waits that may impact their daily routines.
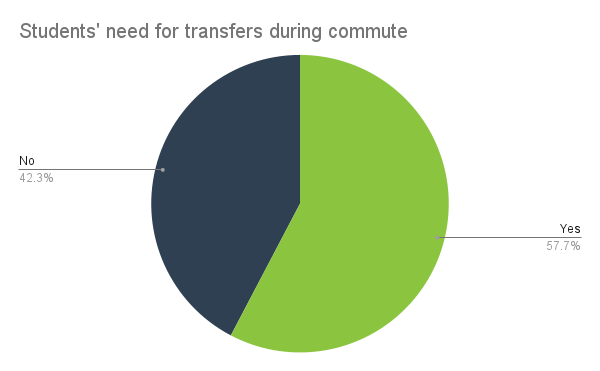
Students' need for transfers during the commute
A significant 57.7% of students need to transfer between different public transport modes or lines during their commute, which may add time and complexity to their travel.
In contrast, 42.3% of students stated that they do not require to transfer to reach their school.
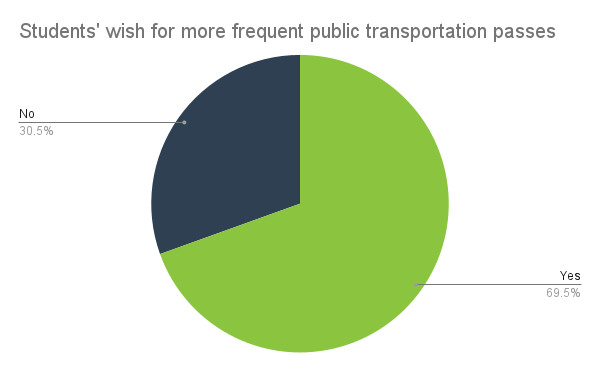
Students' wish for more frequent public transportation passes
A majority of students, 69.5%, would like to see more frequent public transportation passes. Conversely, 30.5% of students are satisfied with the existing frequency.
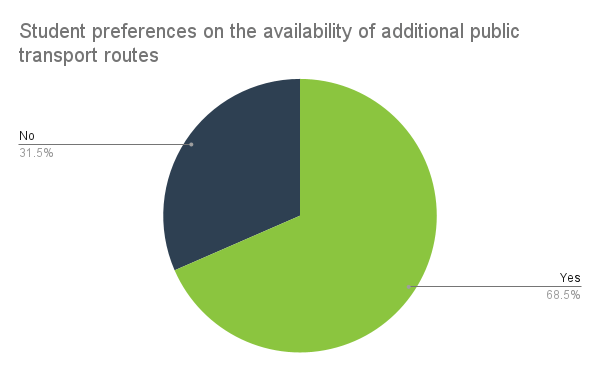
Student preferences on the availability of additional public transport routes
A total of 68.53% of students express a desire for more public transport routes. In contrast, 31.47% of students are content with the current routes.
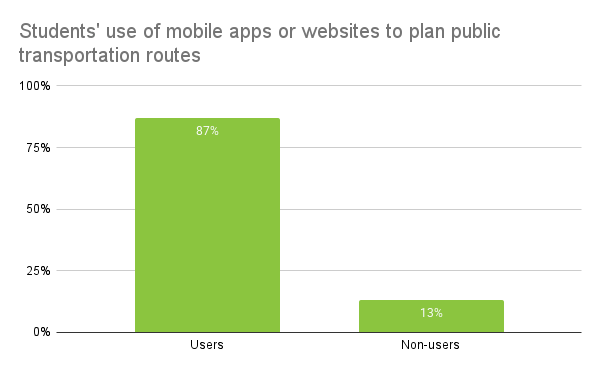
Students' use of mobile apps or websites to plan public transportation routes
An impressive 89% of students use mobile apps or websites to plan their public transportation routes, demonstrating the high adoption of digital tools in route planning. Only 11% of students do not use these resources.
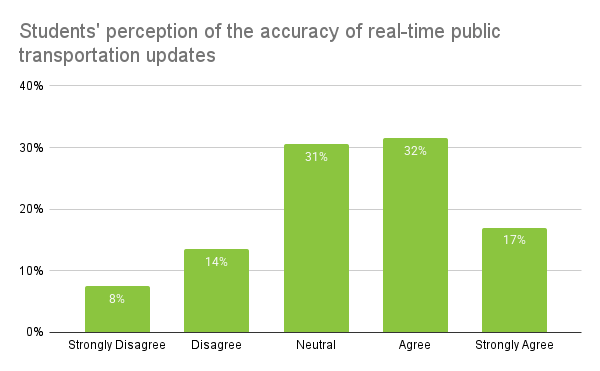
Students' perception of the accuracy of real-time public transportation updates
In terms of real-time updates, 31.5% of students agree that the information is accurate, and 17% strongly agree. 30.5%, indicated a neutral stance, suggesting that they neither agree nor disagree with the accuracy of the updates.
However, 13.5% disagree and 7.5% strongly disagree, with the accuracy of the updates.
Students’ satisfaction with public transportation options and safety during the commute
In addition to the characteristics of their daily commute, it’s important to understand how students feel about their overall experience. Are they satisfied with their public transportation options, and do they feel safe during their commute to school?
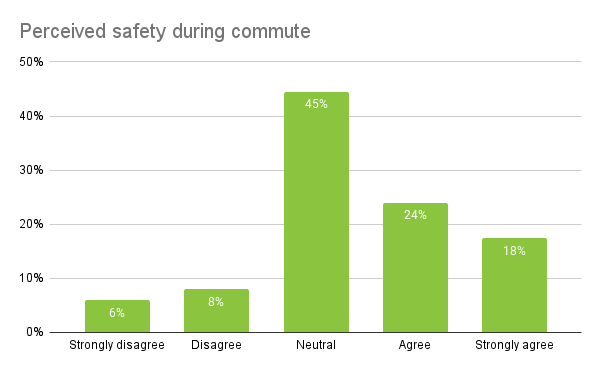
Perceived safety during commute
When it comes to how students feel about their safety while commuting, the survey results indicate a range of opinions. A significant portion, 44.5%, felt neutral about their safety, rating it a 3 on the scale.
This suggests that many students neither feel overly safe nor unsafe during their commute.
However, there are some positive and negative perceptions. Approximately 24% of students reported feeling safe, selecting a 4 on the scale, while 17.5% felt strongly safe, rating their safety a 5. On the other hand, 8% of students disagreed (rating 2) with feeling safe, and 6% strongly disagreed (rating 1), reflecting concerns about the safety of their commute.
These findings point to a generally neutral to positive outlook regarding student safety, but a notable minority of students still express discomfort.
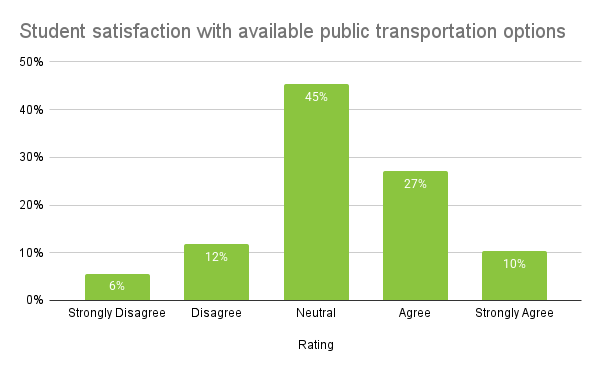
Student satisfaction with available public transportation options
When it comes to overall satisfaction with public transportation options, the results show a mix of neutral and positive sentiments. A large portion of students, 45.28%, reported a neutral stance, rating their satisfaction a 3. This indicates that many students neither feel strongly satisfied nor dissatisfied with the options available to them. However, there is a significant portion of students who express satisfaction: 27.18% selected a 4 on the scale, while 10.33% strongly agreed with their satisfaction by rating it a 5.
On the flip side, 11.73% of students expressed dissatisfaction with the available options, rating their satisfaction a 2, and 5.63% strongly disagreed, selecting a 1. This highlights that a majority of students are somewhat content with the current public transport options.
Other modes of transportation
In addition to public transportation, students are also using a variety of alternative mobility options.
Shared transportation services, electric scooters, and ride-hailing platforms such as Uber and taxis are becoming increasingly available and may offer different benefits for students. In this section, we take a closer look at how students use these modes of transport and the role they play in their overall mobility.
Shared transport apps usage among students
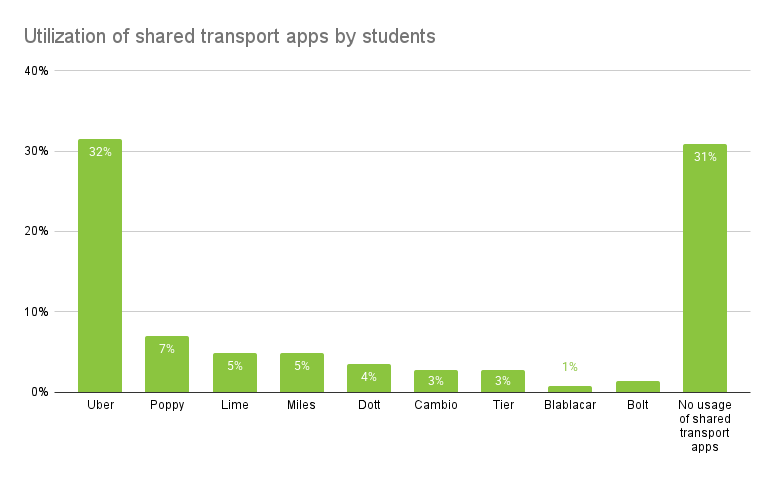
In the context of student mobility, the findings show diverse usage of shared transport apps.
The most commonly used app is Uber, mentioned by 31.5% of respondents. Other shared transport services, like Poppy (7%), Lime (4.9%), and Miles (4.9%), are used to a lesser extent, while even fewer students use services like Dott (3.5%), Cambio (2.8%), and Tier (2.8%).
Notably, 30.9% of students reported not using any shared transport apps, suggesting a divide in preferences or reliance on other transportation methods.
Perception of students on scooters in the streets
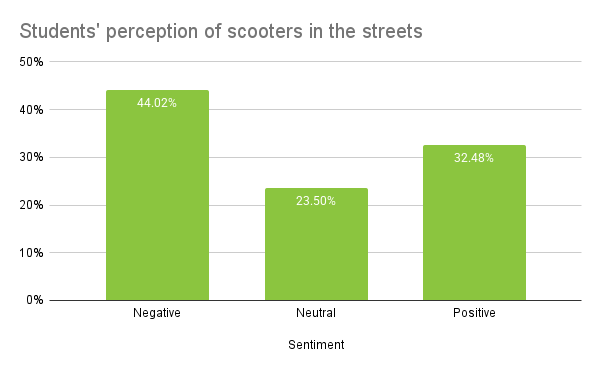
The perception of students regarding electric scooters in the streets is predominantly negative, with 44.02% of responses expressing concerns about their presence. The most common reasons for this negative sentiment include the belief that scooters are dangerous and their impact on the aesthetic of city streets.
On the other hand, 32.48% of students have a positive perception, appreciating the convenience and usefulness of scooters as an efficient mode of transportation for short distances.
The remaining 23.50% of responses were neutral, indicating a more indifferent stance. This breakdown reveals that while scooters are seen as practical, there is a perception that their safety and integration into the city's landscape need to be addressed to increase overall acceptance.
Student preferences: Uber vs. taxi
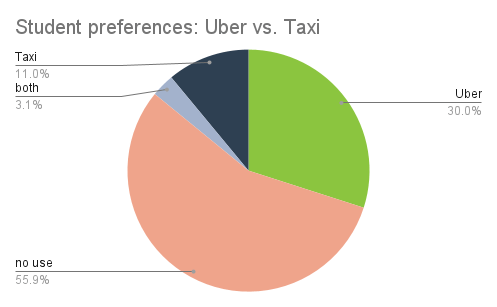
An analysis of student preferences reveals a clear preference for Uber over traditional taxis. Notably, a majority of students (55.9%) don’t use either Uber or taxis, indicating that they favor other transportation options.
Among those who do use these services, Uber is the clear frontrunner, with 30% of students preferring it. In comparison, just 11% opt for taxis, and only a small percentage (3.1%) use both.
Students are drawn to Uber primarily because of its affordable pricing, the ability to see the fare upfront, and the convenience of booking via an app. Both Uber and taxi users often choose these services due to the perception that their choice is the safer option compared to the alternative.
Student's mobility
This study provides a comprehensive look at how Belgian students commute, covering key areas such as student drivers, transportation modes, public transport usage by region, commute characteristics, satisfaction and safety levels, and alternative mobility options.
Public transport remains the most popular choice, though regional differences shape student preferences. While many hold a driver’s license, car ownership is low, with most borrowing family vehicles. Commute times vary, with some students traveling over an hour and requiring transfers. Despite these challenges, public transport is generally seen as accessible, and digital tools help students navigate their journeys efficiently.
As industry experts in student behavior, we continuously conduct in-depth research to help businesses and institutions better understand this key demographic. By analyzing student transportation behaviors, we provide valuable insights that inform companies on student needs within the topic of mobility.

